Kathy Hayes
University of Leeds, School of Geography, Leeds, LS2 9JT, UK
The use of ice cores and thin sections to determine variation in internal ice structure on Storglaciären, Sweden
Aim
The main aim of this research was to investigate internal ice structure variations using ice samples, ice cores and thin sections obtained from the ablation area, accumulation zone and the approximate equilibrium line of Storglaciären, Sweden. The aim of the following report is primarily to display the results and provide some preliminary interpretations of the data.
Location
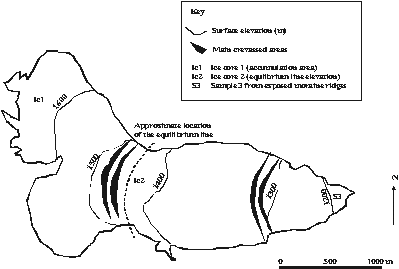
Storglaciären is a small polythermal glacier located in northern Sweden. With an area of approximately 3km2 , mean thickness of 95m and maximum thickness of 250m (Eriksson et al., 1993) it is classed as a typical valley glacier of this region. Composed mainly of temperate ice, but perennially cold it initiates at what can be described as a double basin accumulation zone with maximum elevations of 1700m a.s.l. Converging into a single tongue of ice at approximately the equilibrium line (1450m a.s.l.) it continues to flow down a well-established valley bounded on either side by high ridges. Terminating at an elevation of approximately 1940m a.s.l. it is drained by 2 main glacial streams, namely Nordjåkk on the northern flank of the glacier and Sydjåkk on the southern side (Figure 1).
Figure 1: Map of Storglaciären showing surface topography, equilibrium line elevation and the location of ice cores and samples taken during fieldwork.
Methodology
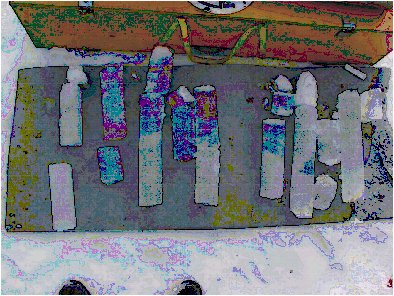
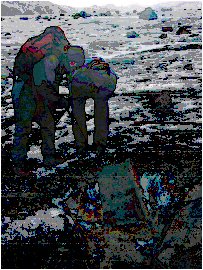
Ice cores were obtained from the equilibrium line using a mechanical, hand-held drill (Figure 2) and cores from the accumulation area via a manual drill. Ice samples were taken from the ablation area, specifically from exposed ice-cored moraine ridges, as drilling was unsuitable at this location. Cores and samples were transported to a cold room where thin sections were created from all samples and analysed using a cross - polarised microscope. A standard methodology was adapted to generate the thin sections and involved the following procedure carried out in a cold room at 10-12° C.
Results
The data obtained from the fieldwork includes;
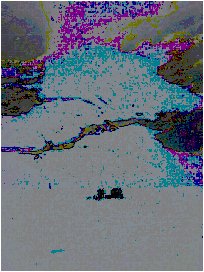
Figure 3: Ice core 2 obtained
from the equilibrium line location.
Figure 4: Location of ice core 1 Figure 5: Location of sample 3
Ice core stratigraphy
Detailed ice core stratigraphy was obtained from the equilibrium line elevation location and is presented below in a diagrammatic log and associated descriptions (Figure 6). The main aim of this detailed stratigraphy was to provide an indication of the main internal structure of the ice and potential locations for thin section generation. A description and brief interpretation of the features observed is included in the log.
Figure 6: Stratigraphic log of ice core located at the equilibrium line elevation.
Thin sections
Thin sections were generated and photographed from various locations on the ice cores. The main aim of the ice cores was to investigate potential variations in internal ice crystal structure at the different core and sample locations.
Discussion
Ice flow changes the size, shape and arrangement of crystals. These crystals therefore provide a history of the ice flow over a time interval that is dependant on temperature and deformation rate (Wilen, 2000). In addition the size, shape and arrangement of crystals also effects the rate and pattern of deformation which provides a feedback on the nature of ice flow. Understanding the internal structure of ice and its relationship with glacier flow is of particular importance as it can significantly disrupt paleoclimatic records, a global use of ice cores today. For the purpose of this study the ice cores were retrieved to investigate the physical properties of the ice at a variety of locations on the glacier. The following discusses briefly the features observed for each location.
1) Accumulation zone (ice core 1)
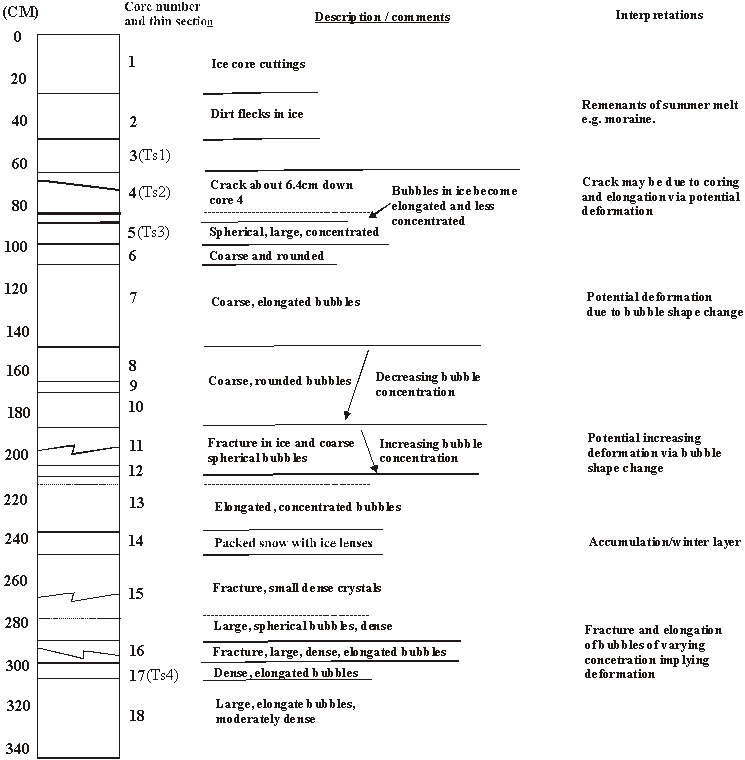
Ice cores obtained from the accumulation zone were specifically obtained to provide examples of firn ice, potentially the youngest ice sample to be obtained. If this were the case one would expect ice crystal structure to be undeveloped and not effected by glacier flow and deformation to any significant extent. From the thin sections obtained for this sample this was found to be the case. The initial ice core exposed large proportions of bubbly ice with the occasional ice lens perhaps represented the summer melt season. From the thin sections, crystals were predominantly small and undeveloped with large proportions of air bubbles and undefined crystal structure. Figure 7 displays a thin section obtained from the firn area. Undeveloped crystal structure is apparent with little evidence of deformation. This is typical of firn ice as it has recently been deposited as snow, therefore ice structures have had limited time to develop.
Figure 7: Thin section
of the firn ice sample from the accumulation zone.
2) Equilibrium line elevation (ice core 2)
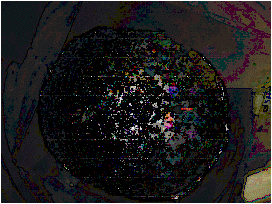
Ice cores taken from the equilibrium line represent older ice that has been transported via glacier flow and undergone some degree of deformation depending on the ice flow and temperature. Numerous thin sections were obtained from this core and a detailed stratigraphy obtained. The stratigraphy presented in Figure 6 represents potential seasonal cycles in the ice accumulation. Due to the small nature of the ice core, internal seasonal horizons are unlikely, but the internal structure of the ice crystals are expected to show differing characteristics to the firn ice.
Figure 8 shows a thin section obtained from the deepest part of the core (core section 17) located approximately 3m below the surface. Ice crystal structure is predominantly well developed with large crystals about 3-4cm in diameter, located in the centre of the thin section. There is no apparent structural deformation features indicating lack of flow at this location. However, due to the shallow nature of the core potential deformation would be expected at greater depths within the glacier.
Figure 8: Thin section from ice core 2 located at the equilibrium line elevation.
3) Ablation area (sample 3)
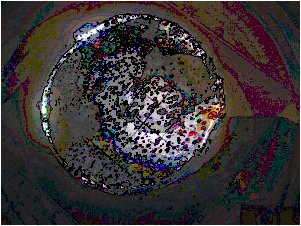
Ice samples were obtained from ice cored moraine ridges at the ablation zone and thin sections created (Figure 9). Ice at this location has travelled the full extent of the glacier therefore, deformation features and variations in the ice crystal structure would be expected. It could be suggested that this location represents the oldest ice of the glacier and hence the most effected by glacier flow and deformation.
Figure 9: Thin section of sample 3 located at the ablation area.
Taken from the moraine ridges located near the snout of the glacier ice crystals larger than observed at previous locations are apparent. Ice at this location is older and subsequently ice crystals have enabled far more growth and development. Lack of internal deformation features at the location suggests that little internal flow processes are at work on Storglaciären. At this stage this is only a preliminary observation as further, deeper ice core drilling would be required before a final conclusion can be obtained.
Conclusions and summary
From the data presented and the preliminary observations made it could be implied that Storglaciären is not a particularly active valley glacier. This is mainly due to the lack of deformation structures and ultimate variation in internal ice crystal structure at the differing ice core locations. However, core sampling was limited and shallow making any observations preliminary and rather tentative. From the data obtained it is far more useful to use this simply as a tool of observing the difference between the internal ice structure of newly formed firn ice and increasingly mature ice of the equilibrium line and ultimately the ablation area of Storglaciären. Increasing ice crystal structure and size can be observed from the firn to the ablation zone, varying from the bubbly mass lacking crystal structure of the accumulation zone to the well defined relatively large crystals observed in at the equilibrium line and ablation area.