Using GPS as a tool to measure glacier velocity
Sue Adair
Department of Geography, Royal Holloway
University of London
Tarfala Reseach Station: EU Glaciology Practical Training Course
Spetember 6th-13th 2000
Course Director: Dr John Moore
Introduction
Tarfala Research Station is located at 67o55’N, 18o36’E in the Tarfala valley of the Kebnekaise massif in Swedish Lapland. Storglaciären and Isfallsglaciären form the basis of the field training received on a eight day European Union funded glaciological course. The course was divided into two sections: the first was based around glacier safety and the dangers faced whilst working in these environments: the second focused on glaciological techniques and methodologies. The course had a practical basis which was supported by theoretical classroom work where necessary. The course highlighted one of the major problems to be faced when working in remote glacial areas, where the weather can play a major force in determining your program of work. Despite some problems, resulting from the weather and equipment failure under less than favourable conditions, the course gave a lot to all participants. Both the safety aspects and field techniques gave a wider insight into glaciological fieldwork and logistics and will make future fieldwork planning and undertaking easier.
In addition to the formal training received, all participants had to give a 15-20 minute presentation during the time spent at Tarfala. This provided an opportunity for the development and practice of presentation skills by all. In addition it gave exposure to the work that all participants were undertaking, something that is always a useful tool to young researchers at the beginning of their career.
During the week long course various techniques were learned that included ground penetrating radar (unfortunately this was of limited exposure due to technical problems with the equipment); ice-core drilling, snow-pit digging and stratigraphy, and the application of GPS (Global Positioning Systems) to glaciology. This formed the basis of the individual project that was carried out.
The Area
The Tarfala valley is a sub-arctic high alpine area with an altitude between 800-2114m.a.s.l . The Kebnekaise massif mountain range dominate the climate of the area giving rise to an east-west gradient resulting in a maritime climate in the west and a more continental climate in the eastern part of the mountains where the Tarfala valley is situated .
The annual average air temperature at the Tarfala Research station is –4.1oC (1965-87), with the average summer and winter temperatures being +5.5oC and –7.2oC respectively, and a precipitation balance of approximately 1000mm year-1, with approximately one third of this falling in summer . In addition the valley is subjected to extreme high wind speeds with a recorded maximum of 81ms-1 during the winter of 1992-93 .
Storglaciären is a temperate valley glacier located in the Tarfala valley, and has been the subject of over fifty years of research concerning both mass balance and glacier front observations. Storglaciären has an area of 3.12km2 with an average depth of 99m extending to a maximum depth of 250m. The glacier lies between 1130m and 1720m altitude . The average equilibrium line is located at around 1485m.a.s.l. .
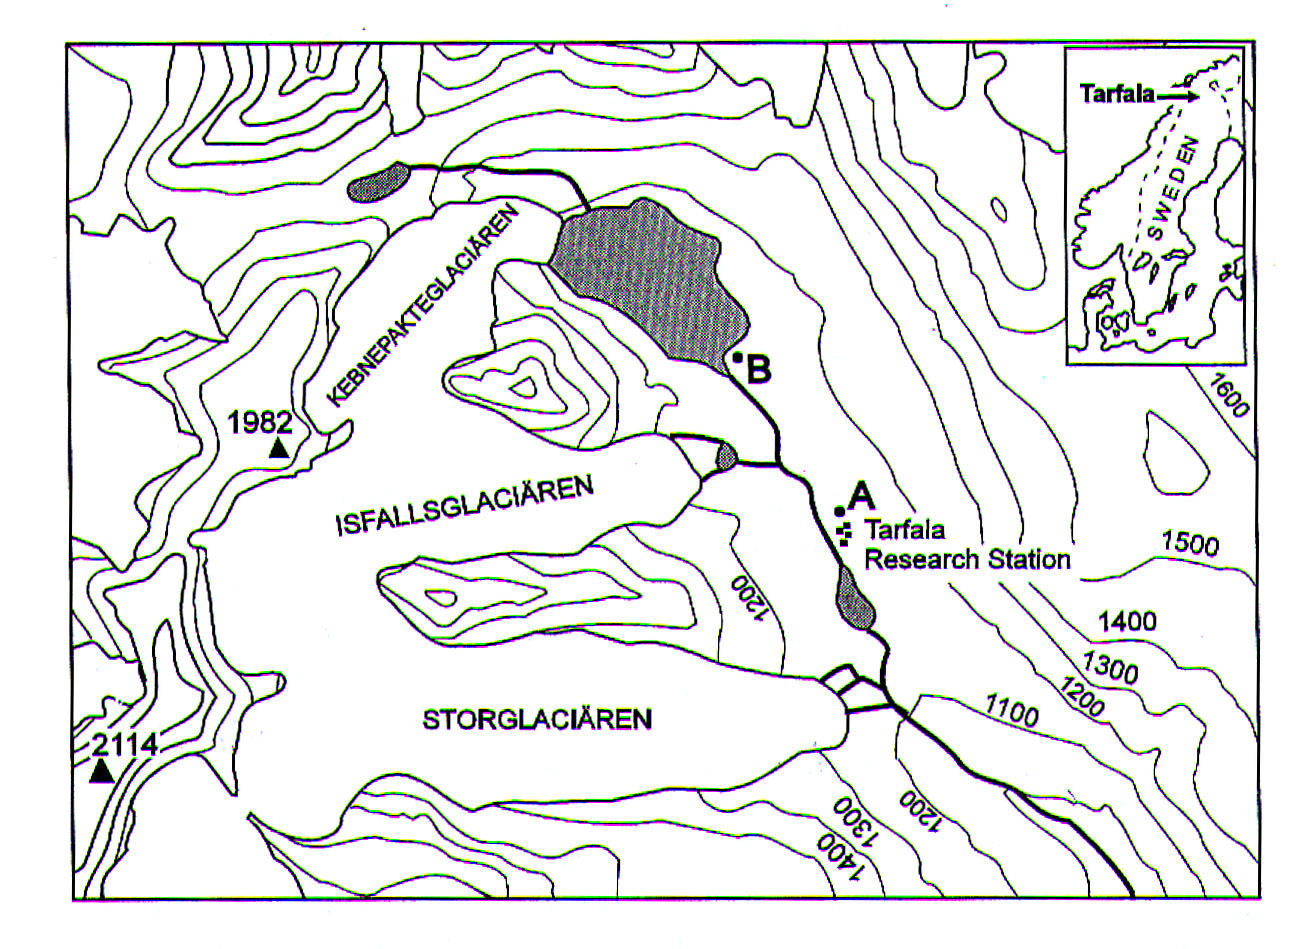
Isfallsglaciären is also a temperate glacier situated next to Storglaciären (Figure 1), but has been the subject of less intensive research. This glacier is 1.32km2 with an average depth of 72m, but extending to 220m at the maximum. This glacier is of a similar altitude lying between 1185-1750m.
Figure 1. Location map of the Tarfala Valley, showing the location of Storglaciären and Isfallsglaciären and the Tarfala Research Station. Source: .
The Project Objectives
As part of the practical training on the course GPS measurements were carried out to determine movement of the glacier in a horizontal direction and mapping of the front of the glacier to analyse advance or retreat of the glacier margin. Measured velocity oscillates around balance velocity (equal velocities in the accumulation and ablation zones to ensure the glacier remains in equilibrium) over varying time-scales from hours to years resulting in the glacier being in disequilibrium with itself. The resultant action will be the advance or retreat of the glacier . These deviations from the balance velocity occur because glacier flow rates depend upon a balance between the driving and resisting forces. These forces maybe out of phase with changes in the glacier mass resulting in departures from the balance velocity .
Past work carried out in the valley has looked at glacier retreat and advance over the twentieth century (Table 1).
Table 1. Glacier front retreat at glaciers in the Kebnekaise area. Source: .
|
Glaciers |
Glacier retreat in myear-1 |
||
|
1915-1965 |
1965-1994 |
1989-1994 |
|
|
Storglaciären |
-8 |
-4 |
0 |
|
Isfallsglaciären |
-7 |
-5 |
+5 |
|
So Kaskasatkäkkog |
-9 |
-6 |
+2 |
|
Rabots Glaciär |
-7 |
-11 |
-12 |
|
Riukojietna |
-14 |
-9 |
0 |
|
Mårmoglaciären |
-2 |
-1 |
0 |
The Technique
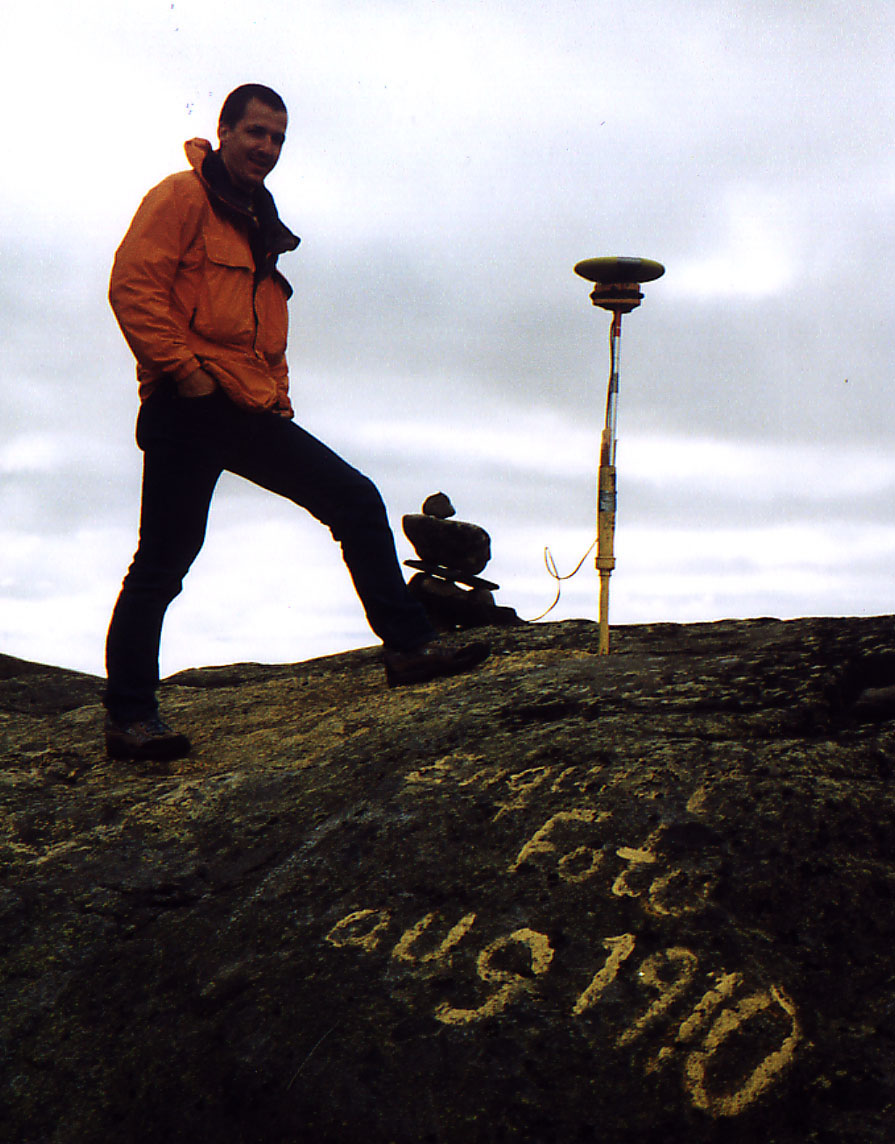
Differential GPS was used to measure stake movement on Isfallsglaciären. This type of GPS was used because of its accuracy, enabling measurements to be given within 1mm accuracy in the x and y direction and 3mm in the z direction. Trimble and Javad GPS systems were used to take both kinematic measurements of the glacier front and stationary measurements of the stakes on the glacier on 12th September. A temporary base station was erected on the Enquist rock (Figure 2) which was used throughout the measurements. The Javad base station was position at the Trimble fixed base station and the roving system at the Enquist rock for approximately 30 minutes to remove any error from the roving system and temporary base station. The Javad base station was then corrected using the location of the Tarfala Base station location (67o54’40.666018"N, 18o36’40.259856"E, 1173.236m). Once both sets of co-ordinates were converted to decimal degrees there was no error in the data between the two base stations. This enabled the data to be corrected for our temporary base station to ensure that the position of the roving system was exact throughout the work.
Figure 2. The temporary Javad base station erected on the Enquist rock.
The method employed to measure the stakes on Isfallsglaciären was as follows: the roving Javad GPS was held stationary at each stake for a period of 3 minutes. During this time interval the system was recording continuously at 10 second intervals to produce a total of eighteen readings per stake. These measurements were then averaged in the post-processing of the data. A total of 20 stakes were surveyed on the glacier, the total number of stakes that could be reached safely. Isfallgalciären is heavily crevassed and during the measurements members had to be roped together and implement running belays (a skill learned earlier in the week) for safety reasons.
The procedure used at the glacier front margin consisted of continuous measurements every 10 seconds whilst walking along the front of the glacier and tracing the margin.
In addition to the stake measurements and the front margin tracing, measurements were taken at four trig points that lie in front of Isfallglaciären employing the same methodology as was used at the stakes. The purpose of this was to ensure that the same baseline measurements are taken each time the stakes are measured to give consistency to the results.
The measurements taken on the 12th September were compared with data taken on the 1st August giving a total of 43 days over which to be able to calculate velocity of the stakes.
The data had to be post-processed using Javad software to convert the data into latitude and longitude in WGS84 projection in order for it to be compatible with data collected with the Trimble GPS by the station research staff. Post-processing also included the averaging of the static data collected over the 3 minute period at the stationary stakes and trig points and kinematic (the process of movement, thus those measurements taken whilst walking) transformation of the data from the glacier margins. The final stage of the post-processing consisted of the correction of the data for the location of the temporary base station with the permanent station at Tarfala and the roving system. This enabled the error correction to be calculated and this factor was used to transform all the data.
The Results
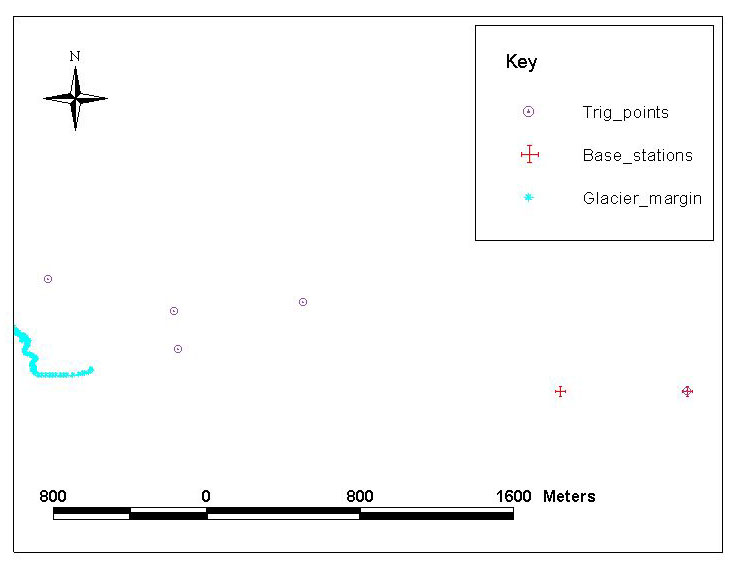
A network of twenty stakes were measured and 4 fixed trig points, plus the two base station recordings. There was zero error between the two base stations, with the permanent base station being 67.9112961N, 18.6111833E, and 1173.236m and the Javad system gave exactly the same position when placed at the Trimble site. This enabled the Enquist rock position to be determined and allow the transformation of the data collected by the roving station (Figure 3).
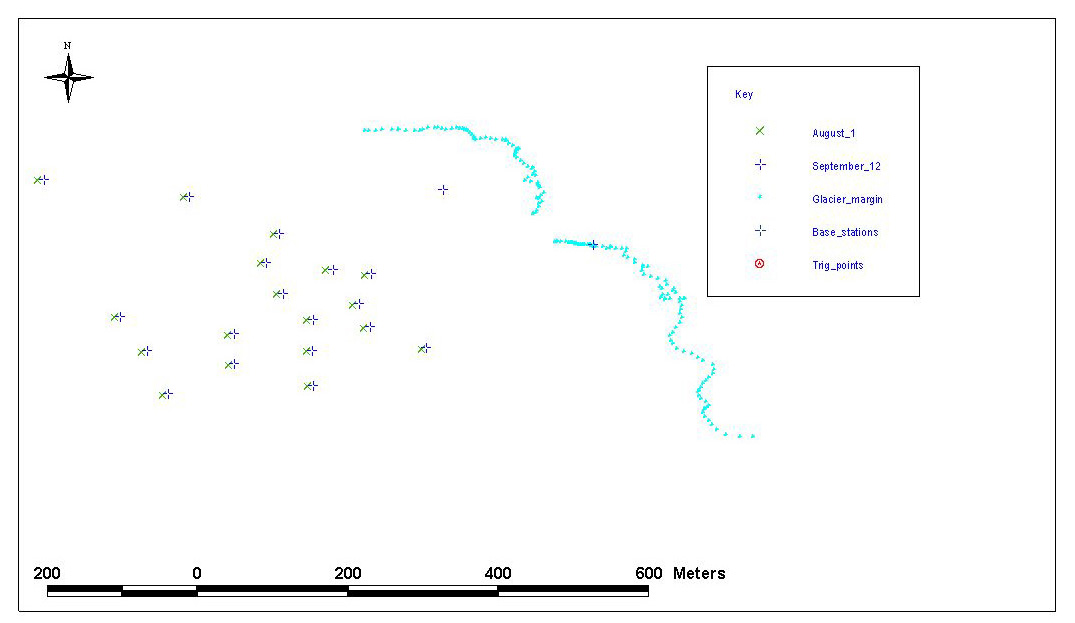
A total of 390 points were collected for the glacier front trajectory, this extended to most of the eastern front margin. Due to the glacier being highly crevassed and insufficient climbing experience by the project team the south east edge of the glacier front margin was unable to be measured. In addition to the data collected in September access was given to stake measurements taken August 1st 2000. The location of the stakes and glacier margin data are shown in Figure 4.
Figure 4. A map showing the stake positions in both August and September 2000, and the front glacier margin in September 2000.
The data obtained for the month of August 2000 were kinematic measurements and hence these records included both stationary measurements at the stakes and the positions recorded whilst moving between the stakes which are non-static. However, the GPS did remain stationary at each stake for a limited period of time. The data had to be processed before it could be used to look at stake movement with the removal of all data that was recorded whilst moving. This processing was carried out using ArcView and MapInfo GIS. Once the two data sets consisted of the two sets of stake readings the data had to be converted into decimal degrees from degrees/minute/seconds format using MapBasic. The stake positions recorded in September were coded to give each stake an identity code, and the relative stake in the August data set was coded to the same stake number. The points in the August data set were then averaged to give a relative position for the stakes in August. The distance the stakes had moved in the x, y, z direction between August 1st and September 12th (a total of 43 days) was then calculated in MapInfo, the results of which are shown in Table 2 and Figure 5, including the errors associated with the height data for September.
The errors associated with the measurements taken in September in the x and y direction were kept below 15mm with the exception of two stakes on the glacier. These exceptions were probably due to their extreme locations and it being heavily crevassed in the vicinity of the stake itself making it difficult to maintain the same stationary position. The errors in the z direction are slightly higher but all remain below 35mm with the exception of the same two stakes. Statistical analysis of the errors in the z direction show that they are not significant at a 95% confidence interval with p values of 0.76 between the two extreme values (error deducted and error added) and 0.91 between the actual movement and that if error were added. Error is associated with movement of the receiver during the recording of readings and the availability of satellites to give an accurate position. Unfortunately at the time of writing it has not been possible to obtain the error statistics associated with the data collected in August.
The error associated with the calculations in Table 2 are also dependent upon the uncertainty attached to the height measurements (z direction) in the August data set. These height values maybe subject to an error of up to a maximum of 2 metres due to the unknown height at which the receiver was placed relative to the ground. The maximum errors that would be associated with a 2 metre inaccuracy in the z direction due to this unknown factor is shown in Table 3.
Table 2. The movement in metres of each stake between August 1st and September 12th, a period totalling 43 days. The movement including errors are the errors associated with the height (z direction) in the September data. These errors ranged between 9 mm and 85 mm with one extreme, stake 15, which had an error of 730mm associated with it.
|
Stake Identification No |
Movement minus errors (m) |
Movement in 43 days (m) |
Movement plus errors (m) |
|
1 |
3.53752 |
3.54253 |
3.54757 |
|
2 |
2.58883 |
2.60457 |
2.62058 |
|
3 |
2.28259 |
2.29225 |
2.30207 |
|
4 |
2.01575 |
2.02821 |
2.04106 |
|
5 |
2.60697 |
2.62042 |
2.63404 |
|
6 |
3.11843 |
3.12843 |
3.13849 |
|
7 |
2.43485 |
2.44275 |
2.45072 |
|
8 |
2.78759 |
2.80355 |
2.81961 |
|
9 |
2.9304 |
2.93511 |
2.93987 |
|
10 |
2.33701 |
2.3471 |
2.3573 |
|
11 |
2.34554 |
2.35421 |
2.36303 |
|
12 |
2.7729 |
2.77843 |
2.78408 |
|
13 |
3.07979 |
3.08533 |
3.09094 |
|
14 |
2.68105 |
2.69464 |
2.70857 |
|
15 |
2.38631 |
2.49751 |
2.80116 |
|
16 |
3.43475 |
3.44713 |
3.45966 |
|
17 |
2.28986 |
2.29863 |
2.30742 |
|
20 |
2.68428 |
2.69987 |
2.71575 |
Figure 5. A map showing the stake locations on August 1st and September 12th 2000.
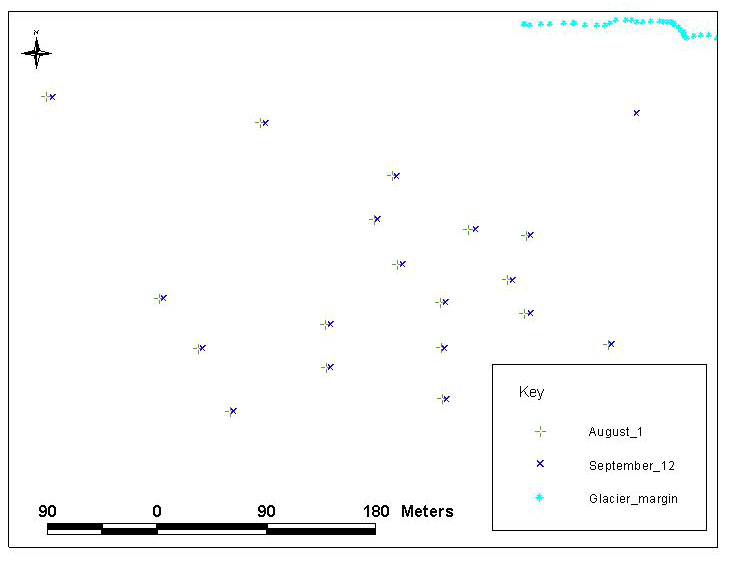
Table 3. The movement of the stakes during the 43 days between August 1st and September 12th. This shows the minimum and maximum movement if the error in the height (z direction) is 2 metres in either direction because of the unknown height of the receiver in relation to the ground. This represents the likely maximum error in the measurements in this direction.
|
Stake Identification No |
Movement with height 2m less (m) |
Movement with height 2m more (m) |
|
1 |
2.93965 |
4.94545 |
|
2 |
2.29562 |
4.03704 |
|
3 |
2.27894 |
3.64901 |
|
4 |
2.21465 |
3.3649 |
|
5 |
2.32605 |
4.04014 |
|
6 |
2.74061 |
4.47921 |
|
7 |
2.32511 |
3.81155 |
|
8 |
2.01343 |
4.43462 |
|
9 |
2.88442 |
4.11216 |
|
10 |
1.97701 |
3.88705 |
|
11 |
2.28237 |
3.72496 |
|
12 |
2.90697 |
3.87154 |
|
13 |
3.11382 |
4.16445 |
|
14 |
2.57426 |
3.98691 |
|
15 |
2.69993 |
3.63119 |
|
16 |
2.77613 |
4.90495 |
|
17 |
1.87478 |
3.87977 |
|
20 |
2.44518 |
4.07427 |
A t-test was carried out to examine the significance of the errors associated with the uncertainty in the position of the receiver relative to the ground. At 95% confidence interval the error is significant in both directions (addition of 2 metres and subtraction of 2 metres) with a p value of 0.0000 and 0.099 respectively. This error margin would need further investigation before the data could be used for further analysis. However, for the purposes of looking at glacier movement velocity this above finding has been ignored. The movement over the forty-three days has been used to calculate the velocity per day and this has been extrapolated into velocity per year (Table 4).
Table 4. The results showing the movement of the stakes on Isfallgalciären during the period August 1st 2000 to September 12th 2000, and the corresponding speeds of movement per day and per year if this rate were constant throughout the year.
|
Stake Identification No. |
Movement during 43 days(m) |
Velocity per day (ms-1) |
Velocity per year (ms-1) |
|
1 |
3.54253 |
0.082384419 |
30.07031279 |
|
2 |
2.60457 |
0.060571395 |
22.1085593 |
|
3 |
2.29225 |
0.05330814 |
19.45747093 |
|
4 |
2.02821 |
0.047167674 |
17.21620116 |
|
5 |
2.62042 |
0.06094 |
22.2431 |
|
6 |
3.12843 |
0.072754186 |
26.55527791 |
|
7 |
2.44275 |
0.05680814 |
20.73497093 |
|
8 |
2.80355 |
0.065198837 |
23.79757558 |
|
9 |
2.93511 |
0.068258372 |
24.91430581 |
|
10 |
2.3471 |
0.054583721 |
19.92305814 |
|
11 |
2.35421 |
0.05474907 |
19.98341047 |
|
12 |
2.77843 |
0.064614651 |
23.58434767 |
|
13 |
3.08533 |
0.07175186 |
26.18942907 |
|
14 |
2.69464 |
0.062666047 |
22.87310698 |
|
15 |
2.49751 |
0.058081628 |
21.19979419 |
|
16 |
3.44713 |
0.080165814 |
29.26052209 |
|
17 |
2.29863 |
0.053456512 |
19.51162674 |
|
20 |
2.69987 |
0.062787674 |
22.91750116 |
The above rates assume a constant rate of movement throughout the year which is unlikely to hold true. To investigate this further these stakes would need to be measured on a monthly basis throughout the year where possible. This would obviously be restricted during the accumulation season when stakes would need to be made longer to be detected above the newly fallen snow.
In addition to looking at glacier velocity, the glacier margin was mapped using GPS (Figure 4). Unfortunately at the time of writing it has not been possible to obtain data for previous years for the position of the glacier margins. If this material had been available it would have been possible to have calculated the movement of the glacier front margin and to determine whether the snout is advancing or is retreating. Without this information it is not possible to determine whether the trends depicted by Holmund (1993) are still holding true.
Conclusion
Unfortunately literature on Isfallgalciären is sparse and so it is hard to compare this data to published literature regarding rates of movement on the glacier. Although these rates may appear on the high side because of the steep gradient on the glacier in the stake network and because the measurements take account of height, it is not unreasonable to assume these rates of movement. However, a more rigorous investigation of past results than time or resources allowed would be necessary to substantiate the rates of movement.
The main objective of the course was to gain practical experience of glaciological field techniques and the application of these techniques as safely as possible through an awareness of the environment and the safety precautions necessary. Everyone on the course received full exposure to both glacier safety and field techniques and was successful in bringing together young researchers from different countries to develop their research training.
Acknowledgements
Thanks are expressed to the European Union for the funding provided to attend this course through their Human Improving Scheme. In addition thanks are expressed to the organisers of the course and the research staff at Tarfala Research Station who provided logistical support. Special thanks are expressed to Rickard Petterson for his provision of the August data used in this work.
References: