Abstract
The ice layers found inside a snow cover on top of the glacier are commonly used on glaciers in order to estimate the winter mass balance rates, because they are thought to be a good indicators of the previous summer layers. Other methods commonly used for distinguishing summer layers are the dust bands and the occurrence of the depth hoar crystals on top of the old summer layers as well as the various reflections received by the GPR from different layers inside the snow cover. How ever the investigation of the latter cases are much more time consuming and need special equipment like a GPR or DEP-device in order to be carried out. In this short paper the errors on winter mass balance studies on glaciers estimated by the traditional probing method are discussed.
Introduction
The mass balance of a Storglacier has been measured continuously for over 50 years. It is one of the best studied glaciers in the world and the measurements there are made with good care. The winter accumulation is measured by using measurement sticks which are drilled inside the ice by the onset of new accumulation season and during the season the sticks are continued in order to avoid them to get buried inside the snow cover. Similarly the ablation sticks are used to estimate the summer melting rate.
However on many glacier such a network of mass balance sticks as on Storglacier are rare and also in old times such a network of sticks didn't exist either on storglacier. On many surveyed glaciers the accumulation measurements are based on data derived from probings. The probing is usually done from the snow surface just before the melting period starts. How ever as seen from the snow pit data from the upper most part of the storglacier (Norra Niche) the occurrence of ice layers at the vicinity of previous summer surface was very complex even tough the site was located well above the equilibrium line (figure 4.). The complex structure of the ice layers may cause big errors to the mass balance studies when only the probing method is used.
Background
The infiltration of the water inside the snow pack is a very complicated process. There are many studies regarding to this problem. (Convay and benedict, 1994, Marsh and Woo, 1984) . In these studies the infiltration of water is described to follow preferential flow paths through the snow cover. When percolating water mass meets more impermeable layer on its way down, it usually spreads on a horizontal way creating an ice layer.
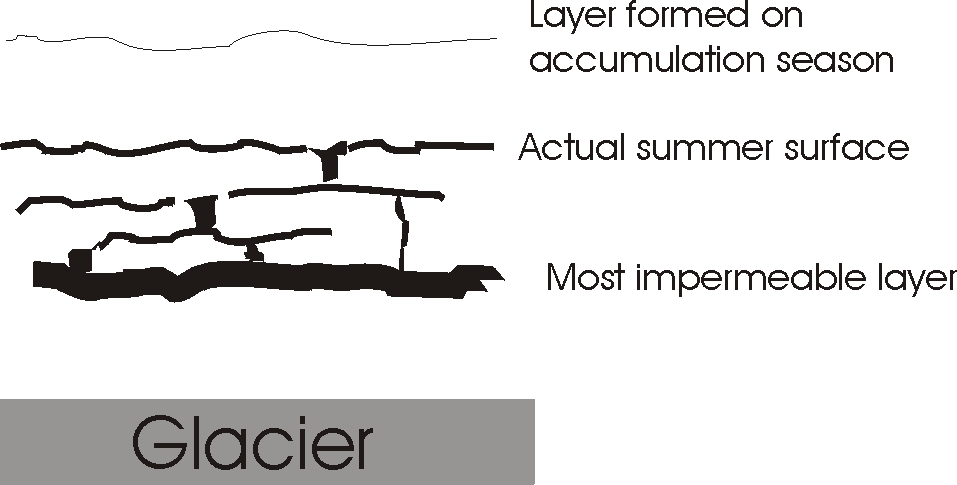
How ever the thickness of the ice layer will vary greatly due to differences in snow structure. In fact many of these ice layers are even discontinuous in horizontal dimension. In nature repeated melt-freeze cycles are common during the ablation season, thus creating numerous different percolating events. Some former ice layers or wind slabs may act like an impermeable layer spreading the water flow horizontally. In some cases the percolating water is capable of penetrating through an existing ice layer and a vertical ice column is formed between the old layer and the layer formed below the previously formed snow pack. This is schematically illustrated in figure 1.
When the snow and also the percolating water gets colder, which usually happens at the end of the ablation season the percolation distance is also reduced. Therefore the new ice layers typically forms on top of the old ones. In many years in the early parts of a accumulation season rain on snow events and also some melting of snow surface can occur forming new ice layers on top of the old ones.
Method
The snow cover from Norra Niche was measured on the 11.9.2000 which means that the accumulation on that site had already started. The upper part of the snow cover was studied by digging a 2 meter deep snow pit. From the 1.5 m wide pit wall the stratigraphy of different layers inside snow was studied in details. The density profile was measured by using 25 cm long cylinder tube and the temperature profile was measured by a digital thermocouple meter. The poor weather on sampling day maid it impossible to study the grain size and shape distribution of the snow
Data
From the temperature profile we could see that the temperature was uniformly very close to the freezing point in top 2m of snow cover. Some slightly positive values < 0.2C are probably due to poor calibration of thermocouple and only in small amount caused by the latent heat released upon refreezing of the meltwater inside the snowcover. However the latent heat is very important factor controlling the snow temperature and summer wave penetration before the new accumulation season starts. The uniform temperature is a good indicator that the melt water had been percolated more than 2m during the ablation season.
At least 8 different ice layers were found from the pit wall. The thickness of these ice layers varied from 0.5 to 4 cm and the distance between the lowest one and the uppermost one was 90cm. Since the accumulation rate within this area is close to 8m. all these ice layers have been formed and developed after the past accumulation season ended, because it's impossible to melt this much of snow during short ablation season at this altitude. From the figure 2 we can see that most probably the previous summer layers were 3 to 3.5 meters below the snow surface. We can also note from the same figure two peaks at this depth, which are formed due to complex nature of infiltration as described before.
The previous summer surface should be very visible when the the dielectric profiling (DEP) is used, because those layers usually contains most of the impurities such as dust particles unless they are redistributes by the percolating meltwater. As we can note from picture 3. we can not distinguish any layer to be the summer layer for sure. The peaks at 3m and 3.5m correlate well with the density peaks at the same depth however the correlation around peak found at 5m depth is much smaller.
Since the density data is integrated to every 25cm values, single ice layers are not visible in the data set. Densities can be best used when the water equivalent of the snow cover is calculated. It is also useful on estimating the amount of water percolating below the previous snow surface, but in order to obtain such data a much deeper pit has to be dug or use the snow cores from the PICO drill.
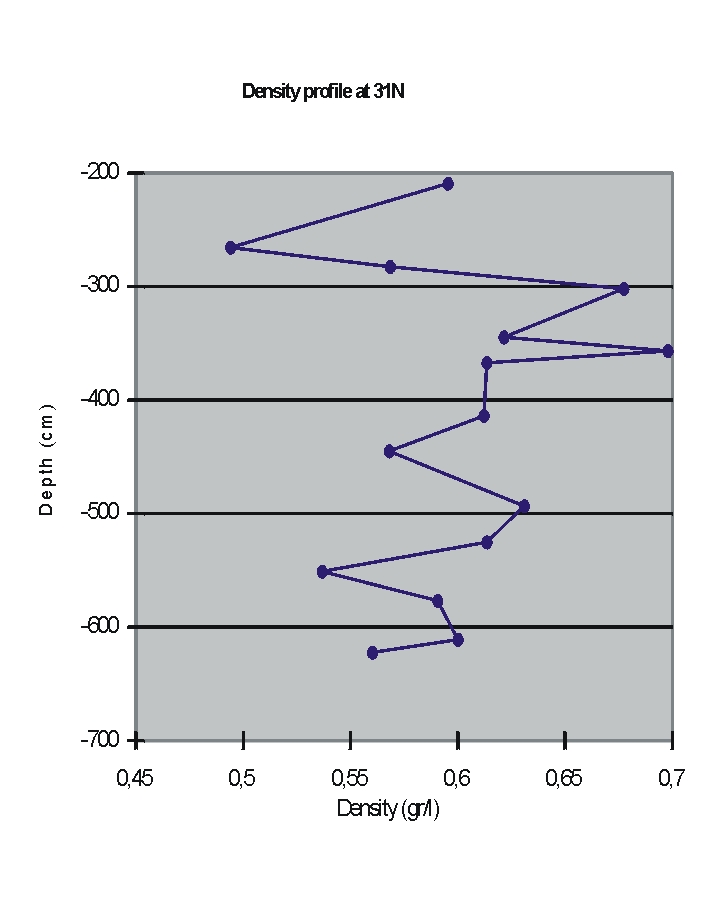
Figure2. Density profile below the 2m. Snow pit, derived from PICO-drill core data.
Figure 3. DEP-data Conductivity and capacitance, from PICO drilled snow core from Norra Niche
Discussion and Conclusion
As a result we can agree that the determination of previous summer layer can be in some cases very difficult even many different techniques are used simultaneously. Therefore lot of care should be taken into account when the previous summer layer is tried to find by probing it from the snow surface with a stick. With a probing stick method at least 3 different cases can occur.
1) the uppermost one (formed at early part of the new accumulation season)
ice layer is detected.
2) actual summer surface is found.
3) the most impermeable layer and thus the thickest ice layer is found
below the real summer surface.
When we look at the figure 4. we can conclude that most probably the probing stick finds layer 1 or 2 having the distance 10cm between them. But since the thickness of layer 2 varied between 0.5 and 4cm it could be possible to penetrate that layer quite easily and thus find the layer 3 or even 4. As we can note from the figure 4. the error in depth can very easily be 10-40cm. With an average snow density of 700kgm-3 and size of accumulation area 105 m2 it results 7 to 28 106 kg. error in massbalance.?This should be taken into account when the mass balance is estimated by probing method on glaciers within similar climate region.
In my opinion the layer 2 is the real summer layer in this case. Layer 1 has formed when the newly accumulated snow has been melted or there has been rain on snow event. Many layers below the layer 2 indicates that percolating melt water have spread horizontally before it has found a new preferential flow towards layers 3 and 4.
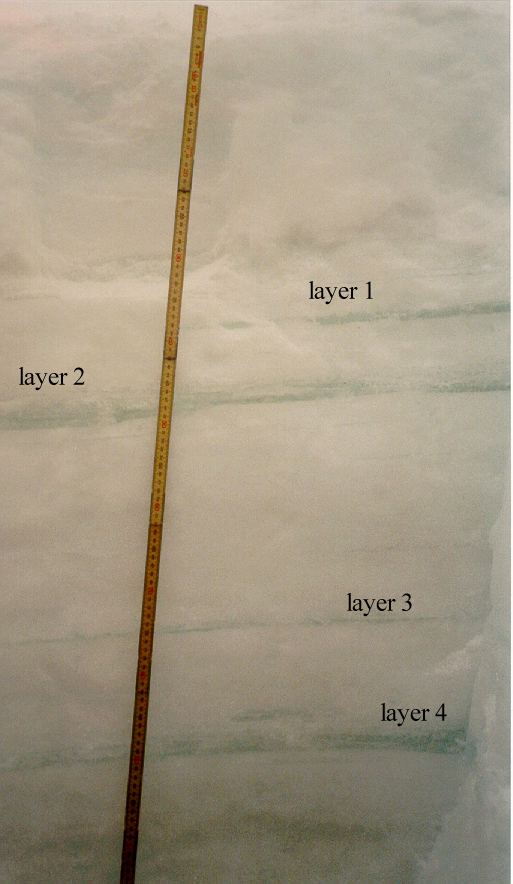
Figure 4. Photograph from the pit wall from Norra Niche. Note that above layer 1 are two and between layer 2 and 3 are about five very thin ice layers which are not visible in this scanned photograph.
Acknowledgements
The author thanks all people who made this nice glacio-eurolab course possible, especially the course leader J.Moore and the people working in Tarfala station. The author would also like to thank RAMAC radar company for making such a reliable radars, which really helped to keep this report very short.
References
Convay H. and Benedict R., 1994. Infiltration of water into snow. Water
resourches research, vol.30, no 3. pages 641-649
Marsh P.and Woo m., 1984. Meltwater movement in natural heterogenous
snow covers. Water resourches research, vol.21, no 11. pages 1710-1716.
Patersson, W.S.B. , The Physics of Glaciers, Second edition, Pergamon
press.