Glaciology research:
We do research ourselves on several aspects of ice and glaciology. Here I break down our research by the subject focus with short highlights of our findings.- Ice flow models
- High Mountain Asia models
- Radar glaciology
- Chemistry of ice cores
- Antarctic blue ice areas
- Climate research
- Advanced statistical tools and methods
Ice flow models
A new discrete particle model helps find insights into one of the major unknowns in ice modelling: calving and brittle failure of ice.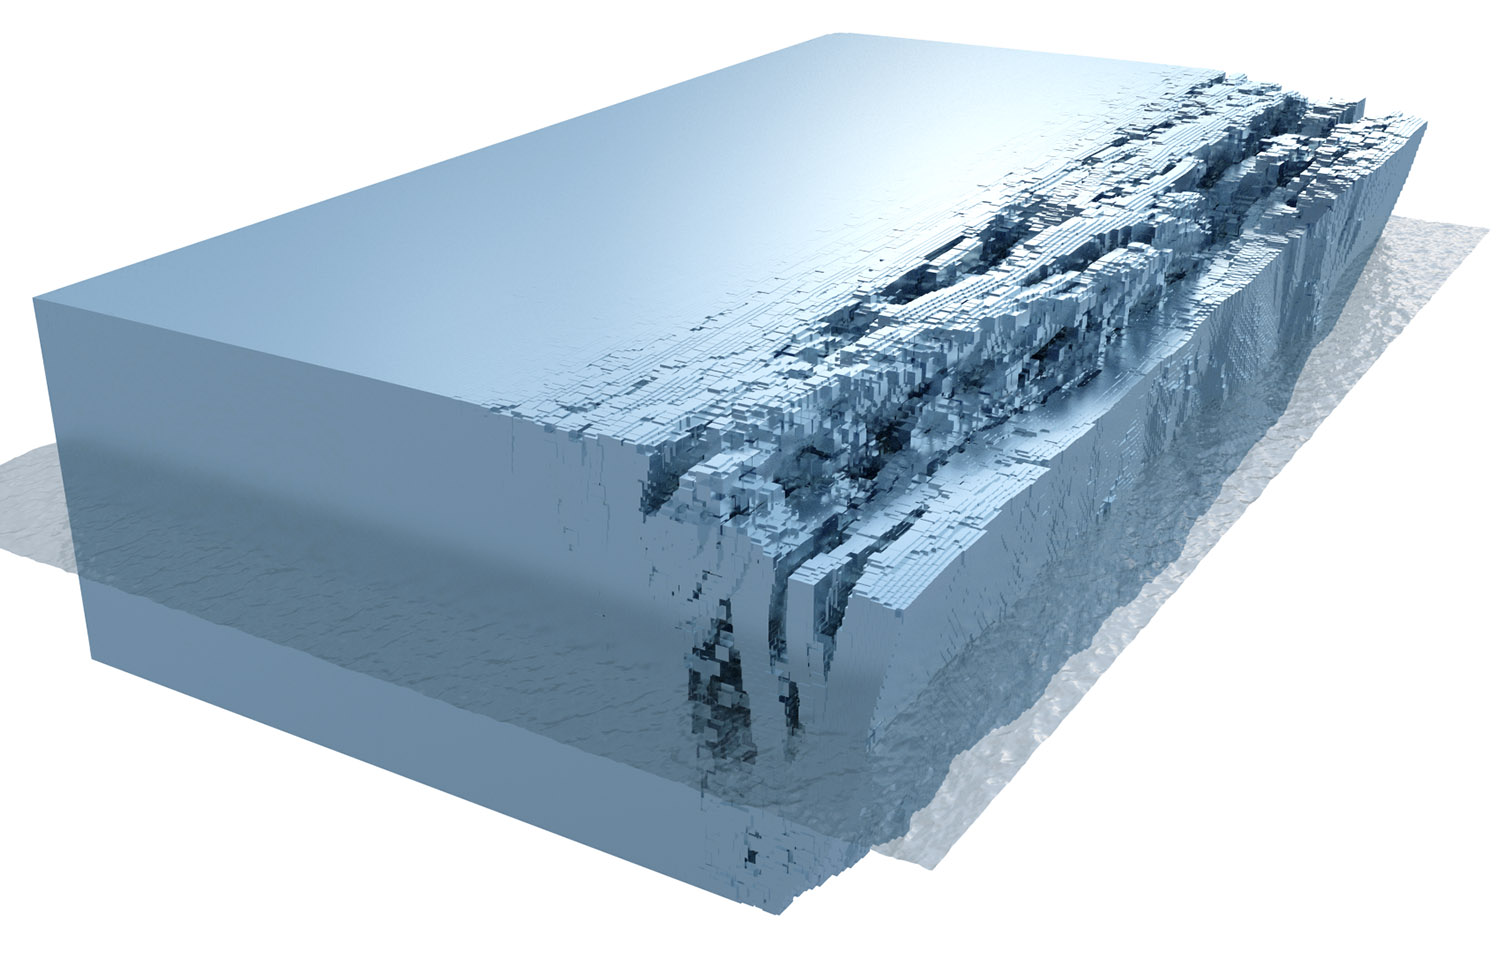
This shows a 3D realization of a calving front. Its a great challenge in many ice sheet models to incorporate calving as effects happen on much much shorter timescales than the viscous flow of ice. We recently wrote about the challenges of ice sheet modelling in a long review paper and how these difficulties impact projections of sea level rise in future.
An example of 2D movie made using the new model scheme shows how ice in a block with a stream running from right to left beneath it causes the ice edge to be undermined and then fall apart under its own weight in quite a realistic way.
The discrete particle lead to an understanding of how glaciers calve in response to climate forcing - a so-called "self organized criticality". In Nature Geoescience we showed how glaciers calvings from tiny events pf metre dimentions to the break up large Antarctic ice shelves are governed by scaling laws. In a related PNAS paper we show how large Antarctic shelves respond to climate such that basal melting feedsback into claving, so climate warming not only leads to mass loss by basal melting, but also means ice shelves retreat by calving, allowing more inland ice to flow easier to the sea.
We are using the ELMER-Ice finite element code which solves the full thermo-mechanically coupled Stokes equations for ice flow. We are integrating models of superimposed ice our interest is primarily in the energy balance rather than the mass balance implications of the superimposed ice. The aim is to apply this to a model of Vestfonna for the IPY Kinnvika project. The importance of superimposed ice on Arctic, and even Antarctic glaciers will only increase with time as climate warming produces more seasonal surface melting.
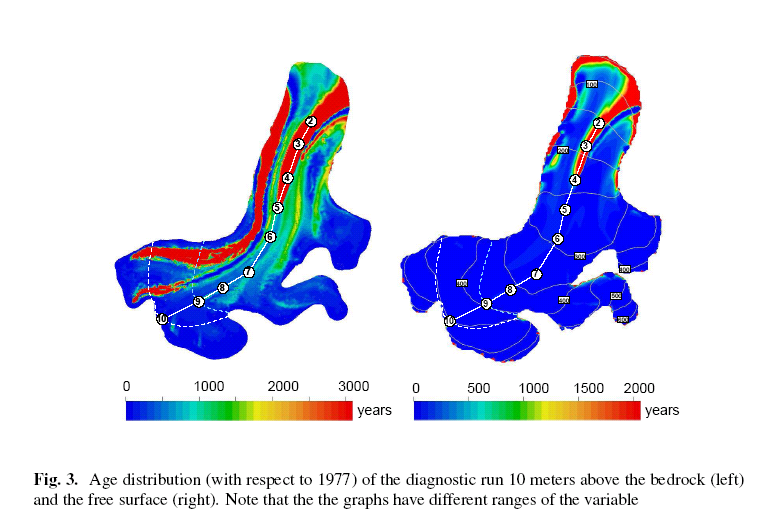
Zwinger & Moore (2009) consider the steady-state and transient finite element models of Lovenbreen - a small glacier on Spitzbergen. This is all we can run based on limits of computing power, real "prognostic" runs modelling the evolution of the glacier on timescales of millennia await orders of magnitude increases in computing powers. However the results we find are I think interesting - the use of internal reflection horizons (isochrons) from radar sounding seem pretty sensitive indicators of glacial-climate dynamics. The transient run quickly reveals and compensates for errors in input DEMs, and the output from the model agrees well with observations of the retreat, and down-wasting of the glacier in the last 30 years. Another output is the age distribution along the glacier surface and lower down - these glaciers certainly provide a source of old ice at their surfaces.
 The Kinnvika project has led to an advanced 3-D coupled thermomechanical ELMER-ICE model
of Vestfonna. The figure shows the basal drag underneath 2 outlet glaciers as derived by inverse modelling based on
the observed surface velocity map of the ice cap and the ice physics defined in the ELMER flow model. This is one of the first
papers that calculates the basal properties - and we performed extensive tests to make sure that
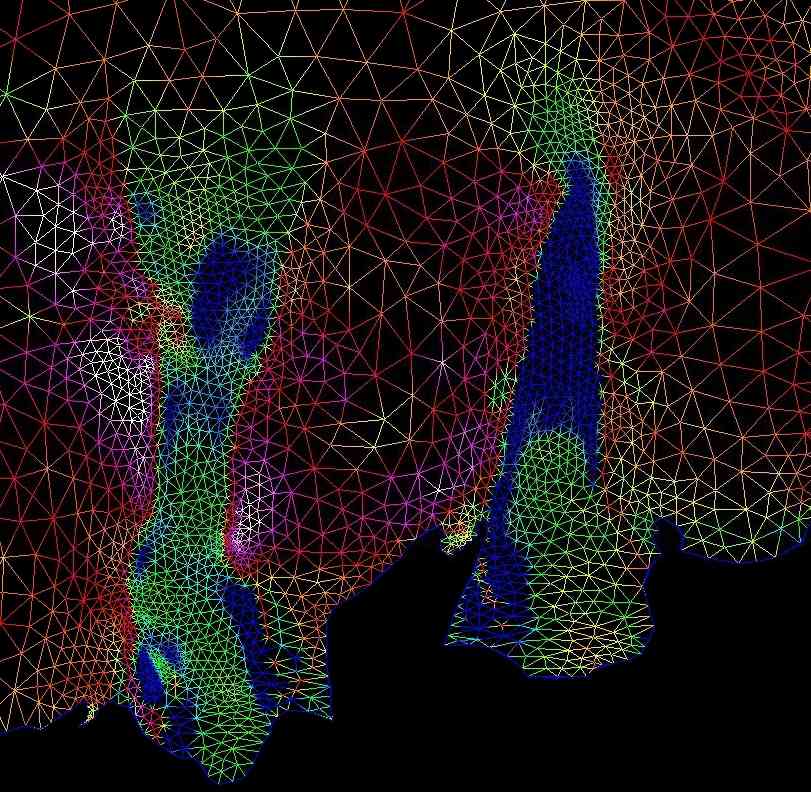
the features we observe are robust and not an artifact of the model resolution. You can see from the finite element grid
in the figure is much finner in the fast flowing glacier than in the higher (top) parts of the ice cap that
flow much slower. Now we are trying to understand how the geographical
distribution of basal drag is related to physical features on the glacier and the possible sources of water
(that aids sliding) to the glacier bed. New research is funded by the SVALI project,
that also is focussed on the neighboring Austfonna ice cap.
The Kinnvika project has led to an advanced 3-D coupled thermomechanical ELMER-ICE model
of Vestfonna. The figure shows the basal drag underneath 2 outlet glaciers as derived by inverse modelling based on
the observed surface velocity map of the ice cap and the ice physics defined in the ELMER flow model. This is one of the first
papers that calculates the basal properties - and we performed extensive tests to make sure that
the features we observe are robust and not an artifact of the model resolution. You can see from the finite element grid
in the figure is much finner in the fast flowing glacier than in the higher (top) parts of the ice cap that
flow much slower. Now we are trying to understand how the geographical
distribution of basal drag is related to physical features on the glacier and the possible sources of water
(that aids sliding) to the glacier bed. New research is funded by the SVALI project,
that also is focussed on the neighboring Austfonna ice cap.
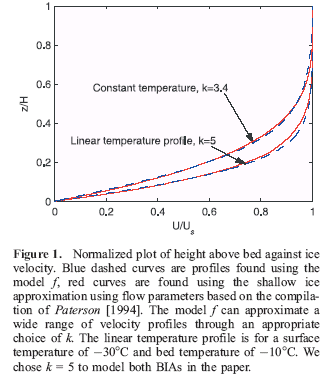
Our earliest flow model was designed to be used on Antarctic blue ice areas, and was a simple flow line model (Grinsted et al., 2004). The model is however, innovative in that it parameterizes the ice rheology impact on the velocity depth profile in terms of the temperature profile in the ice. For blue ice areas this is advantageous as near the equilibrium line the temperature profile should be linear, and since we generally consider relatively short flowlines in these areas, the temperature profile is reasonably fixed all along the flow line.
 The model was used with some success on the Allan Hills meteorite field, but
seems to be relatively poor at modeling the Scharffenberbotnen blue ice area,
where it predicts much too old ice. This is because the model assumes constant
ice thickness over time, whereas we know this has varied in the early Holocene
at Scharffenberbotnen.
The model was used with some success on the Allan Hills meteorite field, but
seems to be relatively poor at modeling the Scharffenberbotnen blue ice area,
where it predicts much too old ice. This is because the model assumes constant
ice thickness over time, whereas we know this has varied in the early Holocene
at Scharffenberbotnen.The model may well be useful for valley glaciers, and is easy to run as it requires only ice thickness, surface velocity and mass balance data. We have used it in a directed Monte-Carlo simulation of Midre Lovenbreen in Svalbard. The finite element model of Scharffenberbotnen has been run in diagnostic - that is steady-state mode, and we are in the process of getting time-varying prognostic simulations running.
High Mountain Asia models
A new topic for us is in statistical modelling glaciers on the Tibetan Plateau. Two papers: one in Global and Planetary Change, the other in Annals of Glaciology highlight how much sea level may rise due to ice lost from the 80 000 glaciers on the Tibetan Plateau (High Mountain Asia).We use some novel statistical methods since field measurements on glaciers are very limited (to only about 10 glaciers). The key unknown is the response of the equilibrium line elevation to climate warming. We find that by 20150 HMA will likely contribute about 5 mm to global mean sea level. This sounds very little - and is less than others have suggested, but it respresents about a 1% volume loss per year from the glaciers, and will have some dramatic effects on local water supply.
Radar glaciology
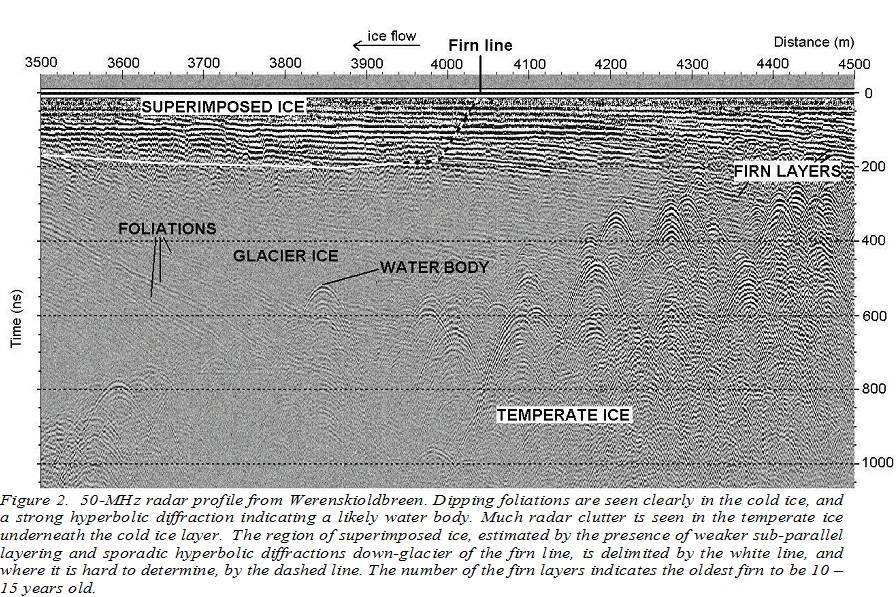
We have used ground penetrating radar (GPR) for many years on glaciers in
Svalbard, Antarctica, and also on Iceland. The main reason for using GPR on
glaciers is to map at high resolution internal features of the ice, such as the
cold/temperate boundary, firn and superimposed ice zones, and hydrology features
such as water bodies, tunnels and moulins.
 The GPR equipment was funded by a Thule Institute project in close cooperation
with the Geophysics departments of the Universities of Oulu and Helsinki.
Two Arctic Studies Program students Stephan Gruber and Florian Ludwig wrote a
nice introduction to ground penetrating radar in glaciology that may be useful for novices.
The GPR equipment was funded by a Thule Institute project in close cooperation
with the Geophysics departments of the Universities of Oulu and Helsinki.
Two Arctic Studies Program students Stephan Gruber and Florian Ludwig wrote a
nice introduction to ground penetrating radar in glaciology that may be useful for novices.
Anja Pälli completed her PhD on radar data from Svalbard,
and Anna Sinisalo on Antarctic glaciers. Anna Sinisalo's thesis contains some good information on Antarctic GPR research.
These papers use results obtained for a Ramac GPR operating at frequencies
between 50 and 800 MHz
Radar data processing: Moore and Grinsted, 2006
Scharffenberbotnen isotopic modelling: Sinisalo et al., 2007
Scharffenberbotnen ice dynamics: Sinisalo et al., 2005
Antarctic accumulation area reflections: Sinisalo et al., 2003
Midre Lovenbreen internal structure: Rippin et al., 2003
Svalbard polythermal glacier hydrology: Pälli et al., 2003a
Firn/ice transitions in Svalbard glaciers: Pälli et al., 2003b
100 years of changes in southern Spitzbergen glaciers: Pälli et al., 2003c
Hydrothermal properties of Hansbreen, Svalbard: Moore et al., 1999
GPR on Glaciers, snow pack and sea ice: Maijala et al., 1998
Summer surface by GPR in Norway: Kohler et al., 1997
Other approaches with radar data have been to model properties from ice core chemistry
or estimations of ice chemistry (in the case of the moon Europa).
Modelling Svalbard GPR reflections: Kohler et al., 2003
Modelling radar internal reflections from the Greenland GRIP ice core: Miners et al., 2002
Tying ice core features and GPR reflections: Pälli et al., 2002
Modelling Jovian moon Europa radar absorption: Moore, 2000
Early attempt to use an ice core to forward model radar: Moore, 1988
Chemistry of ice cores
A new paper in JGR makes use of a novel application of multiple linear regression (MLR) to extract volcanic sulfate signals in ice cores. This method was tested on ice cores from Svalbard and from glaciers in central Asia. All these ie cores are difficult to date because the characteristic volcanic sulfate spikes from eruptions are buried in sulfate from other sources such as ocean storms, anthropogenic emissions, terrestrial dust, or biogenic sulfate sources. Additionally many ice cores suffer seasonal (or even diurnal) melting, potentially mixing the signals. The new method is objective and easily applied, and could help define the volcanic record from a much wider geographic region than traditional ice cores from central Greenland Antarctic ice sheets.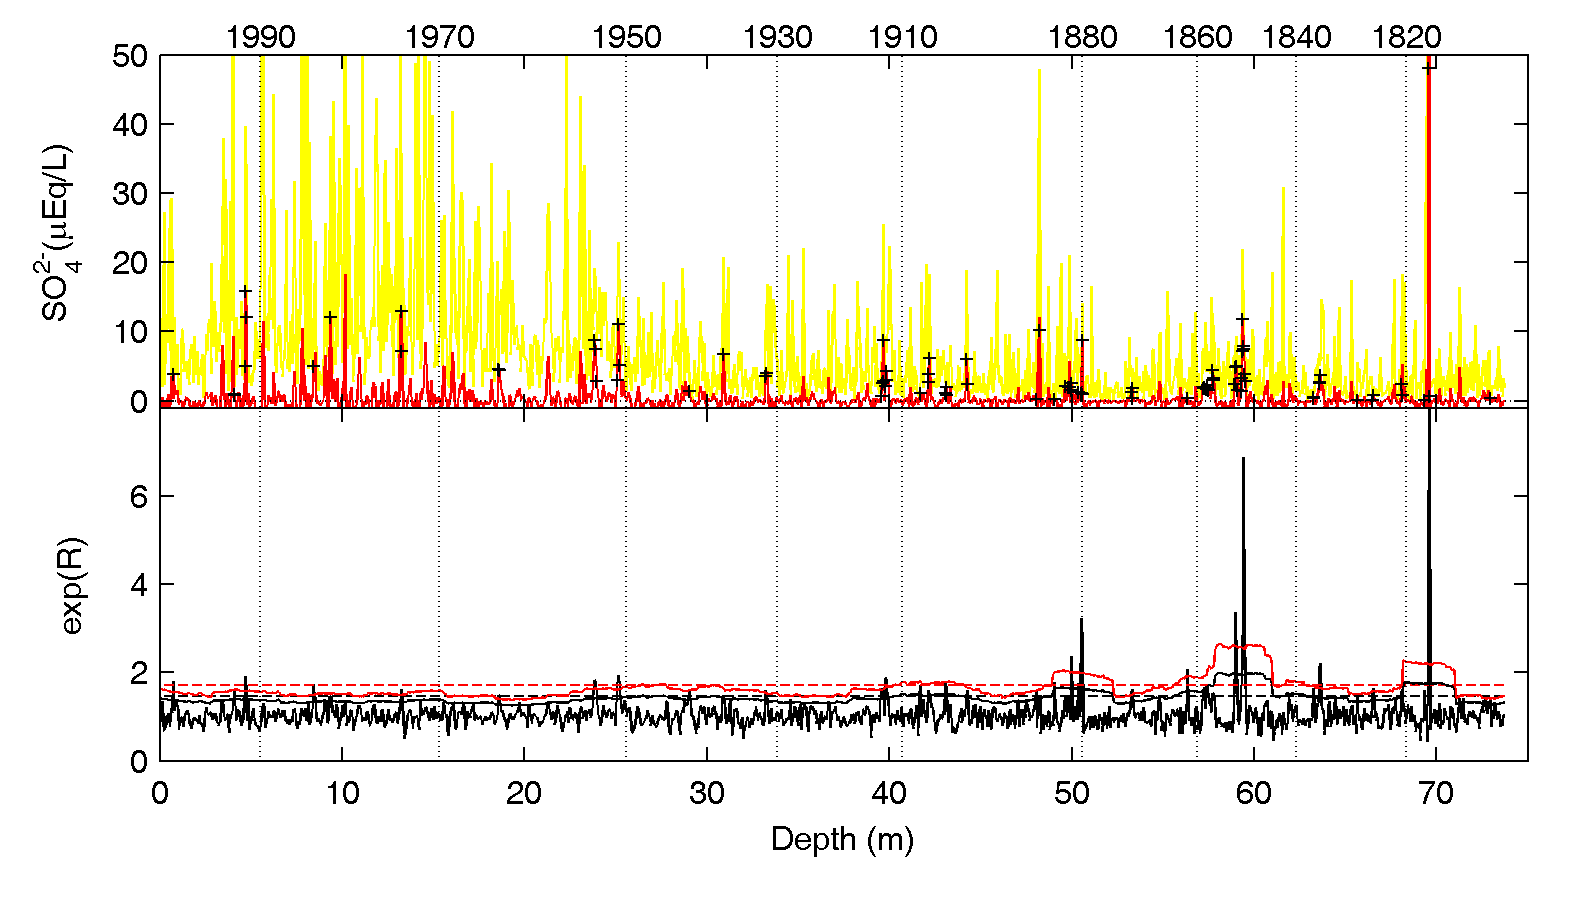
The figure shows the Sulfate (yellow) and residual (red) in uEq/L as a function of core depth. Bottom eR for the Belukha ice core from Centra Asia. 99% and 95% significance levels are shown as red and black lines, with dashed lines based on the variance of the whole core, while solid lines are the based on variance within the 100 point window used for MLR fits in log space. Crosses indicate significant peaks at 95% level of residual of whole core or at 99% significance in the windowed test. Volcanic signals are not easily identified on the yellow plot after about 1940 (30 m depth) becuase of sigificant anthropogenic sulfate increases However significant residuals are easily identiable and include three of most well known recent eruptions: Pinatubo (1991),El Chichon (1982) with fallout in 1983, and a second year of fallout in 1984, and Agung (1963) - this was confirmed by radioactive fallout measurements.
The Lomonosovfonna ice drilled in 1997, and the publication list shows that a great deal of research was conducted on the Svalbard ice core. Teija Kekonen performed most of the chemical analyses. Perhaps the most generally useful finding was that cores with seasonal melting can and do preserve and interesting and meaningful record of past climate and environment, at least as far as chemistry and stable isotopes are concerned. This was shown clearly by a percolation model and PCA analysis (Moore et al., 2005), and expanded on by Moore and Grinsted (2008) showing that ice facies type simply affected mean concentrations of ions and while sufficient variability existed to record features such as a very low level (5-10% volcanic input to the sulphate budget.
Novel proxies were developed (Grinsted et al., 2006) based on ion concentrations and models of the melting process. Similarly the oxygen isotope data led, after quite some analysis and manipulation to a continentality record of sea ice extent. See the The Little Ice Age and Medieval Warm Period page.
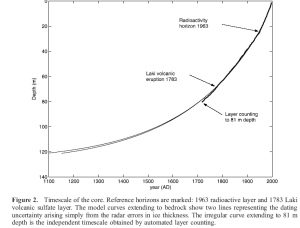 Dating of the ice core (Kekonen et al., 2005)
was achieved using a modified Nye flow model where we had
accumulation rates between 1963 and 1997 constrained by the tritium radioactivity
spike left by the Soviet Novaya Zemlya atmospheric tests in 1961.
Another (30% lower) accumulation rate was found between this horizon and the
large acidity and tephra spike conclusively identified as the Laki volcanic
eruption of 1783 (Kekonen et al., 2005b).
The dating model also used radar measurements of ice cap
thickness and matched well counting of cycles in the stable isotope record
(Pohjola et al., 2002).
Near the base of the core a subtle, but highly significant spike in sulphate
(Moore et al., 2006)
that was initially dated at 1244, which is within 2% of the probable date of 1259,
assuming that this spike is actually the well-known eruption signal seen in
many Greenland and Antarctic ice cores. This is discussed in more detail in
Significance testing
Dating of the ice core (Kekonen et al., 2005)
was achieved using a modified Nye flow model where we had
accumulation rates between 1963 and 1997 constrained by the tritium radioactivity
spike left by the Soviet Novaya Zemlya atmospheric tests in 1961.
Another (30% lower) accumulation rate was found between this horizon and the
large acidity and tephra spike conclusively identified as the Laki volcanic
eruption of 1783 (Kekonen et al., 2005b).
The dating model also used radar measurements of ice cap
thickness and matched well counting of cycles in the stable isotope record
(Pohjola et al., 2002).
Near the base of the core a subtle, but highly significant spike in sulphate
(Moore et al., 2006)
that was initially dated at 1244, which is within 2% of the probable date of 1259,
assuming that this spike is actually the well-known eruption signal seen in
many Greenland and Antarctic ice cores. This is discussed in more detail in
Significance testing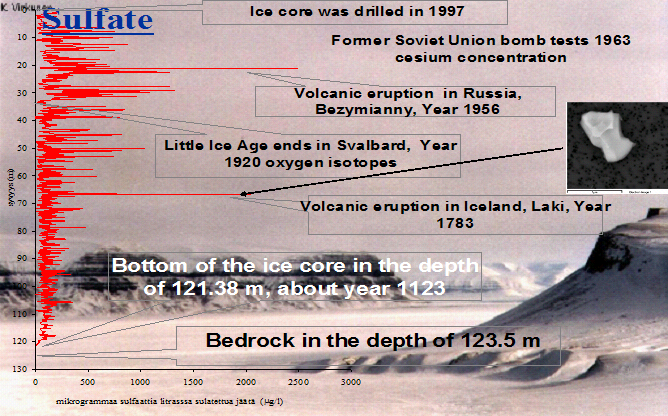
Planned coring on Vestfonna, will be done in April and May 2008. In spring 2007 a small group of Finnish and Swedish researchers went on to the ice cap to perform preliminary work for the future coring and other activities on the ice cap. The expedition blog tells much more.
Our first publication from Vestfonna is now out in The Cryosphere, on the subject of frost flowers. These are features that form on fresh sea ice in cold conditions, and result in fractionation of ions from the sea water. They have been observed in Antarctica, and inferred to be the origin of "negative excess sulphate spikes" in ice core records. We report the first evidence of them in the Arctic - and infer that they are formed by the unusual sea ice dynamics in Hinlopen Strait, where sea ice is continually forming, but being removed by strong ocean currents. Usually Arctic sea ice is older than in Antarctic pack, and also somewhat warmer perhaps explaining why frost flower signatures in the Arctic snow and ice chemistry have not been detected previously.
Antarctic blue ice areas samples have been collected and chemically analysed since 1999. This data set is composed mostly of Holocene ice since it appears that most of the western Dronning Maud Land blue ice areas were accumulation areas in the Late Glacial Maximum. This research is on-going, see the next section for more details.
Antarctic blue ice areas
 A paper accepted for Antarctic Science provides a review of our understanding of
Antarctic blue ice areas emphasizing their paleoclimate applications.
A paper accepted for Antarctic Science provides a review of our understanding of
Antarctic blue ice areas emphasizing their paleoclimate applications.
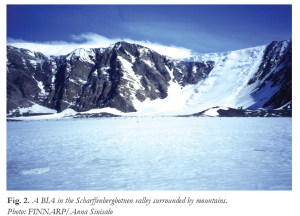
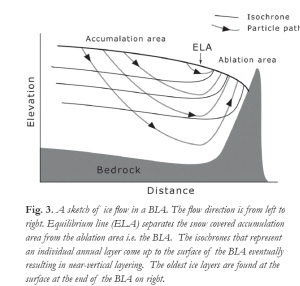
The Antarctic blue ice areas can have very old ice at the surface. Sampling ice from the surface of the blue ice areas is a relatively inexpensive and simple way of collecting ancient ice for paleoclimatic studies. The temporal resolution of the paleoclimatic record obtained from the surface blue ice is also much higher than in deep cores. The principal problem in interpreting ice core records from the blue ice areas has been in dating the ice. The research group has formalized several methods of determining both the surface age, and how the ice flows inside one particular blue ice area: Scharffenberbotnen. In particular the project is
- 1. Using blue ice surface samples to provide a record of paleoclimate from an area of Antarctica that has had little data to date.
- 2. Searching for high resolution indicators of the mechanisms of climate change at the last very major climate transition: the end of the last ice age.
- 3. Determining the stability of the blue ice areas in Antarctica over the climate and ice sheet changes that occurred over a glacial cycle.
- 4. providing evidence on past ice sheet elevation and flow patterns in the Heimmerfrontfjella region.
- 5. utilizes advanced mathematical methods we have developed to understand the blue ice areas to infer mechanisms of climate change from other data sets.
 Recovery of a 2.6 km long section of ice Scharffenberbotnen blue ice area in
Antarctica is allowing construction of a high resolution record of climate
change through the Holocene.
Recovery of a 2.6 km long section of ice Scharffenberbotnen blue ice area in
Antarctica is allowing construction of a high resolution record of climate
change through the Holocene. In contrast with traditional ice cores that are taken from the high remote interior of Antarctica, this core is about 300 km form the coast, and so provides a much better record of Southern Ocean variability, and at much higher (annual) resolution than is possible from the much drier interior.
This ice section was collected by John Moore, Aslak Grinsted and Kristiina Virkkunen between November 2006 and February 2007. Novel geophysical analysis was done on the ice surface using two new instruments - a laser dust scattering device, and a high voltage electrical impedance system. High definition video of the ice surface for albedo and cryoconite studies were made, and other video made for PR purposes.
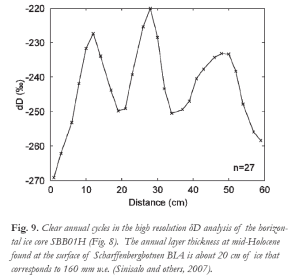
Kristiina Virkkunen has completed 95% of the 2500 chemical analysis of the 2.6 km horizontal core. Stable water isotopes (1500 samples) are also 95% completed by Dutch partners.
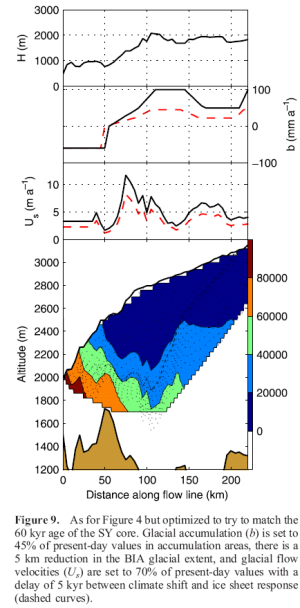 We published a paper
with Japanese colleagues showing how to extract paleoclimate
information from a blue ice field, and how information on the ice sheet flow
over hundreds of kilometres and some 60 000 years can be inferred from the blue
ice samples from the South Yamato Mountain blue ice field.
We published a paper
with Japanese colleagues showing how to extract paleoclimate
information from a blue ice field, and how information on the ice sheet flow
over hundreds of kilometres and some 60 000 years can be inferred from the blue
ice samples from the South Yamato Mountain blue ice field.
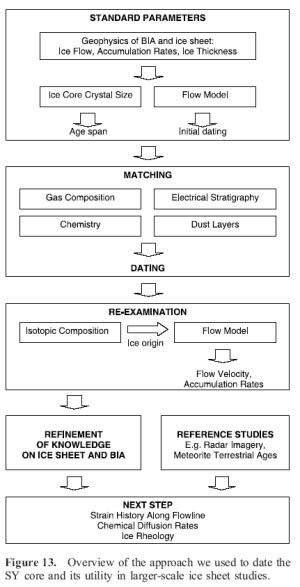
The process made use of low resolution gas content measurements and high resolution electrical data to match the records with existing traditional cores. the initial ages of the ice were determined by ice crystal growth rates and initial mass balance and ice velocity data. Terrestrial ages on meteorites were also used to constrain the surface age of the ice. After finding a good dating for the SY core, its age and location revealed the history of the ice velocity and accumulation along the flowline between the blue ice ablation area and the deep Dome Fuji core.